
How the Tides Work
As a new sailor, just learning to sail, the thought of figuring out tides can be quite intimidating. We know that even some seasoned sailors tend to just wing it – a dangerous concern. This Learn to Sail series article will dispel any concerns about understanding, reading, and predicting tides.
Gravitational Pull
Tides took a lot of figuring out by some very smart people over the ages including Galileo.
But now that the principle causes of tides are understood and quite well mathematically modeled, they are pretty easy to understand by the average Joe when explained properly.
Tides exist solely because of the celestial bodies the moon and the sun. The moon is relatively close but comparatively small. The sun is far away but a giant when it comes to mass. Gravitational pull increases linearly with mass but decreases inversely with the square of the distance. So when you balance these out and do the calculations, the sun’s effect is 46% that of the moon.
So the moon has the dominant and most noticeable effect on the earth’s tides. However, the Sun still has a significant effect.
There are a couple of tricks to understanding the tides that took physicists quite a while to figure out in the old days. The moon circles the earth about every 28 days. During this time the earth completes a rotation every 24 hours. So in effect from a relative point of view, the moon appears to rotate around us every 24 hours and 50.4 minutes. Given that you’d think that there would be one high tide every 12 and a bit hours. But for most of us, it seems that the tide takes about 6 and a bit hours to go out and 6 and a bit hours to come back in. That’s a frequency of 12 and a half hours, not 24:50 hours. What’s up with that?
Tide is actually a gravitational concept rather than specifically related to the movement of our oceans. All celestial objects are susceptible to tidal effects from other “relatively close” bodies. Consequently, a planet within gravitational range of another body will experience pull leading to stresses acting to deform the shape of the planet.
That means that as the moon circles the earth, the earth is deformed by the moon. Similarly, the moon also experiences deformation by the earth and thus suffers a tide effect. The effect is called tidal force. Fortunately for life on earth, the deformation is small but it does lead to the rising water that we experience. Therefore, without the moon, life on Earth would be vastly different.
As noncelestial body and gravitational experts, we’ll probably struggle to understand the resultant effect because it happens in a way that we might not initially expect.
Double Bulge Phenomenon
It is sufficient for this description of tides to state that the planet doesn’t just bulge towards the distant body but actually bulges on both sides in a line between the center of the two bodies because of the volumetric stress imparted upon the planet. Various arguments still exist on why, some are flat-out wrong and some are right. As sailors, we really don’t care too much other than knowing the result.
To gain a visual appreciation for this, although not in any way accurate in science, take a calamari ring and hold two points opposite each other. Now hold one side still and pull the other side. You’ll see the ring bulge on both sides in a line in the direction of pull.
That is a similar resultant action to what the earth is experiencing. The bulge occurs on both sides of the planet diametrically opposite each other and in the plane of a line between the moon and the earth. So following this, we have a high tide on the same side of the planet as the moon and simultaneously on the opposite side. Thus leading to a theoretical tidal period twice for every rotation of the moon about the earth.
The double bulge concept has nothing to do with the spin and inertia of water on the earth, although you will find some arguments and textbooks reporting this as a contributing factor to the opposite bulge. Not so! In any case, again as sailors, we don’t necessarily care too much. We just need to know and realize that the double bulge occurs to explain two tides in a day rather than matching the periodicity of one moon rotation per day.
The exact same concept is valid for the sun. A solar high tide exists on the same side of the earth as the sun and simultaneously on the opposite side of the sun.
Theoretical Tide Heights
Now let’s look at a few theoretical mathematical numbers for comparison. If the earth’s oceans were uniform in depth and no landmasses existed and just considering the moon and if the moon was rotating around the earth every 24 hours, plus a few other ands and ifs, then the theoretical rise of the water at high tide would be 54 cm (21 inches). Now consider the sun’s effect in the same way. This would lead to a theoretical tide rise of 25 cm (9.8 inches). If the moon and the sun aligned or were directly opposite (from the bulge theory above) then we could add these heights together and get 79 cm (31 inches). If the moon and sun were acting against each other by being 90 degrees apart, then we would subtract the numbers and be left with a tidal height of 29 cm (11 inches).
The phenomenon then of a spring tide has thus been explained. Spring tide is when the sun and moon align or are diametrically opposite. The word spring does not come from a relationship to the season but from the concept of “force”. This means there is more force during this period of alignment, which occurs about every 14 days – full moon and new moon.
Consequently, a neap tide is the minimal tide effect from the action of the sun and moon opposing each other. When they are at 90 degrees from each other – not diametrically opposite each other due to the double bulge effect. Again, this occurs at a period of every 14 days.
In addition to the above, the sun and moon operate in elliptical orbits relative to the Earth. You can then imagine as the sun and moon become at their closest points to the earth that a greater effect would take place. The effect is increased 18% for the moon and 5% for the sun. Since the earth rotates about the sun once per year, at certain times of the year then you would expect all these phenomena to exist simultaneously and create a theoretical tidal height of 93 cm (37 inches).
You can also imagine a common high high tide condition existing when the moon is closest to the earth with the moon and sun aligned (or diametrically opposite). This is called a perigee spring tide and occurs every 7.5 moon cycles.
This can be further expanded to include the sun being at its closest point along with the moon and in a spring tide situation. This occurs every 18.6 years. For this reason, tidal high high and low low measurements are recorded and reported over periods of 19 years by statistical governmental recording agencies.
There is one last effect to discuss and that is that the sun and moon’s orbits are not directly aligned with the pole of the earth. Both the sun and moon’s orbits are not in unison and change day by day. For this reason, the height of each high tide will vary day by day.
And just in case you’re wondering, Venus provides the next greatest tidal effect on the earth. But it is less than 0.001% of the magnitude of the Sun’s effect.
We’ve added a rudimentary animation of the Moon’s and the Sun’s tidal forces on the Earth at https://www.youtube.com/watch?v=XZNnb9YP1xg. The animation shows the Moon’s larger tidal force in blue and the Sun’s smaller tidal force in yellow turning relative to the Earth with different frequencies. You’ll need to view it several times to see that when the bodies are aligned either on the same side or diametrically opposite, the tidal forces align creating a spring tide. You’ll see Neap tide occur when they are 90 degrees apart. Of course in reality, the earth rotates about the sun but for relativistic purposes of an observer standing on the Earth, this demonstrates the effect. Additionally, we did not simulate the 7.5 lunar periods before the cycle repeats nor did we show differing declination of the orbits or the elliptical shape of the orbits … and a few other things.

How the Tides Work
In Reality
So now let’s take out some of the theoretical arguments and start adding back in landmasses and differing ocean depths. The effect is called Bathymetry. These effects greatly affect the timing, tidal heights, and periodic frequency of the tides at different places on the Earth. Regardless of this, the tides still occur with periodic consistency in each location according to the above discussion of the moon and sun movements. This last sentence, matched with empirical data over time, means that tidal predictions are very accurate, both height-wise and time-wise.
Let’s say that again; Tides heights and times are highly predictable!
Most places on the planet experience two high tides every 24 hours and 50 minutes as discussed above. This is called a semidiurnal tide. However, due to bathymetry, some places experience one high tide every 24 hours and 50 minutes. This is called a diurnal tide and is experienced in the South China Sea, the Gulf of Mexico along with a few other places. Another significant departure from the theory is the experience of two differing heights of tides. This is called a mixed tide and is experienced in quite a few places including the west coast of the United States.
Keep in mind that 100% of the reason for departure from a semidiurnal tide in these locations is solely due to Bathymetry. Bathymetry is also the reason for departure from the high tide being at exactly the same time as the moon at its highest apex in the sky overhead (or diametrically opposite the planet). As an example, in Norfolk Virginia USA, high tide is approximately 2 ½ hours before the moon passes overhead. Typically on the planet, a spring tide occurs 2 days after a full or new moon.
Bathymetry also explains why tidal height in some places is far greater than the theoretical predictions above. As water moves and slushes around the planet it does so with lunar (and semi-lunar) frequency setting up a crowding effect of the water in certain places.
Regarding all the above discussion about high tides, for every high tide, there is a corresponding low tide. As sailors, we’re pretty concerned about low tides and low low tides due to grounding issues. For mixed semidiurnal and semidiurnal tides, low tides occur every 12 hours and 25.2 minutes. Low low tides occur at spring tide every 14 days about 2 days after a full moon or new moon. And lowest low tides occur every 7.5 lunar cycles when there is a perigee spring tide situation.
The Tidal Map
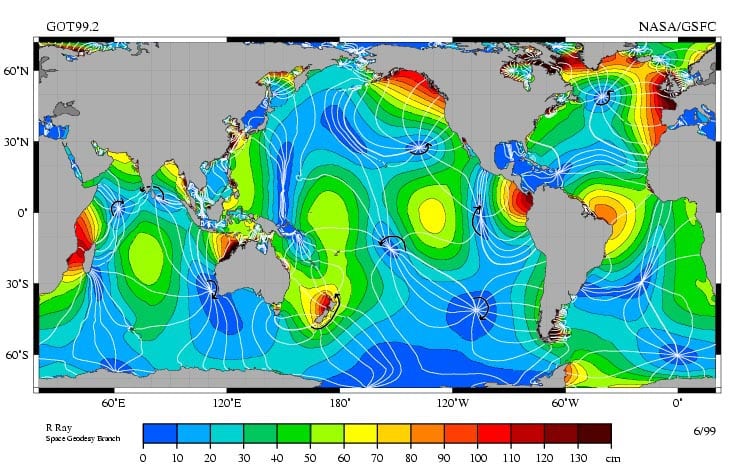
Putting it all together, and considering the periodic consistency, bathymetry, and real empirical data, NASA has developed a tidal map of the planet. The map is quite revelational and will help you understand tides even further.
Tidal Map of the Earth
Grey parts are landmasses. The colors on the map represent the amplitude (height) of the tide. Note the locations marked in red. These are well-known really-really high-tide areas. Some in excess of 40 feet (11m). Also if you’ve ever sailed in the Caribbean or Mediterranean, you’ll have noticed a distinct lack of any tide. These are marked in Blue.
Of particular interest for me is the west coast of my home country, New Zealand. Near Auckland, two estuaries, one from the west coast and one from the east coast are separated by about 500 meters of land only. Yet the tidal difference is hours apart and the two tide heights are vastly different. Similarly, take a look at the area around Panama. Extreme high tides exist on the west coast and almost none on the east coast. The UK also has some very interesting tidal results, particularly in the Solent area.
The highest tides in the world can be found in Canada at the Bay of Fundy, which separates New Brunswick from Nova Scotia. At some times of the year the difference between high and low tide in this Bay is 16.3 meters (53.5 feet), taller than a three-story building. Anchorage, Alaska, comes in at a close second with tidal ranges up to 12.2 meters (40 feet).
The white lines on the NASA map above represent a one-hour difference in time for a high (or low) tide. Note how the lines appear to be randomly placed around the planet without any particular reason for their placement. Again this is due to bathymetry. Of note however is that over time, the lines don’t move. For example, the blue region in the middle of the South Pacific where the white lines converge always experiences little to no tide. The high tide travels around this point in a clockwise direction. The amphidromic point where the lines meet defines the meeting point of high and low tide giving rise to a consistent zero tide effect. In fact, at most amphidromic points as such in the southern hemisphere, the tide turns clockwise due to the Coriolis effect of the earth spinning. In the northern hemisphere at most amphidromic points the tide turns anticlockwise (counterclockwise).
What does this really mean? It means that if you consider the amphidromic point near Hawaii and the radical lines from it incident on the west coast of the USA, then the high tide must move north along the coast over time. IE the high tide in Los Angeles will be after the high tide in San Diego (San Diego being south of Los Angeles). Of significant value when understanding this is that if you can read a table showing the high tide in one place you can predict the time of the high tide in another location. Look at the southern part of the southeast coast of South America. The high tide occurs all along that region at almost the same time but over approximately the same distance along the east coast of New Zealand, which experiences 5 hours of high tide time difference. Interesting!
It is doubtful that even the most complex mathematical models could predict all this. However, combining the empirical data with the periodic frequency of the two celestial bodies gives us everything we need.
Practical Application of Reading And Understanding Tides
Whether we’re experienced sailors or just starting out in our learn to sail quest, chances are you’ll be sailing in an area where tides are happening.
One of the greatest reasons you need to understand and deal with tide heights is when you are anchoring. Anchor at high tide and you might find yourself stuck tipped sideways on the ocean floor a few hours later. Anchor at low tide and with a lee shore and you might be blown onto the rocks when your anchor scope becomes less than sufficient to allow the anchor to hold.
Tides are also significant when dealing with bridges. Cleverly, charts list bridge heights as height above high tide – not low tide.
There is some language around the practical application of tides that we now need to learn.
- Ebb tide: Water going down towards low tide
- Flood Tide: Water coming up towards high tide
- Slack Water: Times when the water movement due to tidal effects is minimal. Note that because of the time it takes for bays and estuaries to drain out, slack water is not necessarily at high tide and low tide. Consult current tables to learn slack water times.
- MHHW: Mean higher high water level. Average height of high tides at spring high tide
- MLLW: Mean Lower low water level. Average height of low tides at spring low tide
- Chart Datum: Reports of water depth on charts are taken at MLLW
- Bridge Heights: Reported on charts as the height above MHHW
- Tide Current: Flow of water due to tides
Below is a tidal prediction chart for a buoy position in La Jolla, San Diego, California. Note a few things: (1) The prediction is extremely close to the observed. (2) That it occurs twice per day – Semi diurnal (3) The heights are different with in the same day – Mixed Semidiurnal. (4) The low tide drops below the MLLW.

Tide Data in San Diego
Rather than carry around masses of graphs as above, convenient tide tables have been produced by the maritime agency in almost every country that borders an ocean. Visit your local chandlery and they’re bound to have a copy of the local tide table. Or search on the Internet. In the USA go to https://tidesandcurrents.noaa.gov/tidesXX – where XX represents the last two digits of the year you want to explore. Tide tables are abundantly available to us.
So whenever we want to know the time and height of the tide we can just consult the tide tables. And from the above, we now know and are very confident that, they will give us a very accurate prediction. Tables are arranged to give us tidal heights and times at most well-known ports called Reference Stations. Time and height adjustments are then provided to get predictions for lesser-known ports that are called Subordinate Stations.
To predict your tidal information from written tables find the closest Reference Station, then make the time and height adjustment from that Reference Station to your closest Subordinate Station. Because of the power of computing, on the Internet, many Subordinate Station calculations are already done for you. In this case, you can just look up the tide heights and times directly at your location. Most of us don’t carry Internet-connected laptops on our boats so the ability to read and understand the table is paramount.
For example, from a table, you might read the time and height of the low tide on the afternoon of January 15th 2010 in Los Angeles. But if you are further north in El Segundo in Santa Monica Bay, the tide will be slightly different. From the NASA-developed tide map above you at least know that high tide will occur later because of the anticlockwise turn of the amphridomic point near Hawaii, but by how much time and by how much amplitude? Thus we consult an adjustment table.
Below is a typical tide table for Los Angeles. Click the image to go to this page on the tidesandcurrnet.nooa.gov website.

Tide in Los Angeles
You can read (probably with glasses) that the afternoon low tide occurs in Los Angeles port at 3:46pm and is 0.7 feet below the MLLW chart datum.
Correction tables will show that for the Subordinate Station of El Segundo, the correction from the Reference Station of Los Angeles will be to add 13 minutes for low tides and to add 13 minutes for high tides. And to multiply the low tide reported in Los Angeles by 0.96 and the high tide by 0.96.

Correction of Tide for El Segundo
Thus the afternoon low tide in El Segundo will be at 3:59pm and will be 0.67 feet below MLLW.
The below table confirms that result. Click the image to go to this page on the tidesandcurrnet.nooa.gov website.
 So there you have it. You completely understand tides and can now use the table to predict tide times and heights.
Of considerable further interest is the currents produced by tides. These must also be understood, especially as sailors, because in many cases your sailboat can not sail as fast as the tidal current. San Francisco Bay is a good example of this. Module 1 of the NauticEd Skipper Course discusses Tidal Currents and their prediction.
This article was written by Grant Headifen, Educational Director of NauticEd. NauticEd is an online sailing school providing sailing courses and sailing certifications for beginner to advanced sailors.
Learn to sail online with NauticEd.


