
How to solve a tide height using the rule of twelves
The Rule of Twelves Tide Plot Curve
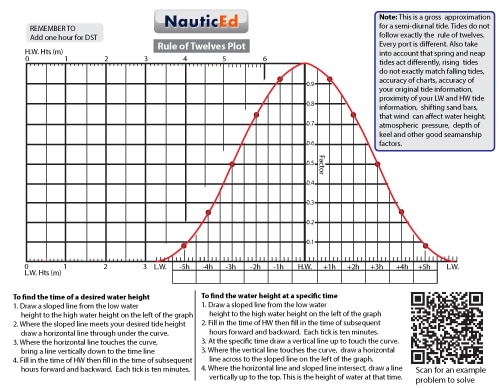
Here is a tide curve plot for any tides that follow the rule of twelves (note that none do exactly but it can be a decent rough approximation for some semi-diurnal locations).
Tap on the image and you can download a PDF that you can print out, laminate and keep on your boat with erasable markers.

A rule of twelves tide plot
NOTE:
If you are going to use this you had better make sure that the tide at the location of interest actually approximates this curve. Too many sailing instructors and sailing associations teach that tides follow the rule of twelves. They DO NOT. It can be a decent approximation in some circumstances. You are far better off to use an actual plot for that location using real data.
Below are some good example problems with solutions to follow so that you understand exactly how to use a tide curve. The QR scan code will lead you to these problems as well. Thus, if you forget and you are on your boat, just scan the QR code with your mobile phone and the example problem will show. A QR code scanner is being embedded into the new NauticEd Sailing App .
Take our Coastal Navigation sailing course to REALLY understand tides


