Learn more about sail trim with either NauticEd’s FREE Basic Sail Trim Course for any aspiring sailor, or learn more comprehensive techniques with the Advanced Sail Trim online course.
How to read Polar Plots and True vs Apparent Wind Triangle
Explained easy
Below we explain the polar plot diagram in a very simple manner using a typical generic monohull sailboat. Once we explain it, we use the polar plot to generate a true wind / apparent wind/ boat speed triangle.
A racer friend said to me recently that when a decrease in true wind velocity is experienced on your boat, this is not a knock and conversely when an increase in true wind velocity is experienced this is not a permanent lift. This all assumed no change in direction.
This concept is not entirely intuitive because there are boat speed versus wind speed factors and wind triangles at play and nothing is entirely linear. It kinda turns your brain upside down thinking about it but my friend Jamie pointed out a little bit of logic – a knock on one tack becomes a lift on the opposite tack. But if the wind direction does not change, with only a change in velocity – then you can’t have a lift on one tack and a knock on the other tack. Ok, that makes sense – sort of!
If you’re unfamiliar with the terms lifts and knocks, see this blog article:
https://boating-knowledge.nauticed.org/lifts-and-knocks-in-sailing/
So I had to test it out on a polar plot to test the hypothesis that he is right. He is a racer and so that is why the hypothesis is ‘he is right” was proposed.
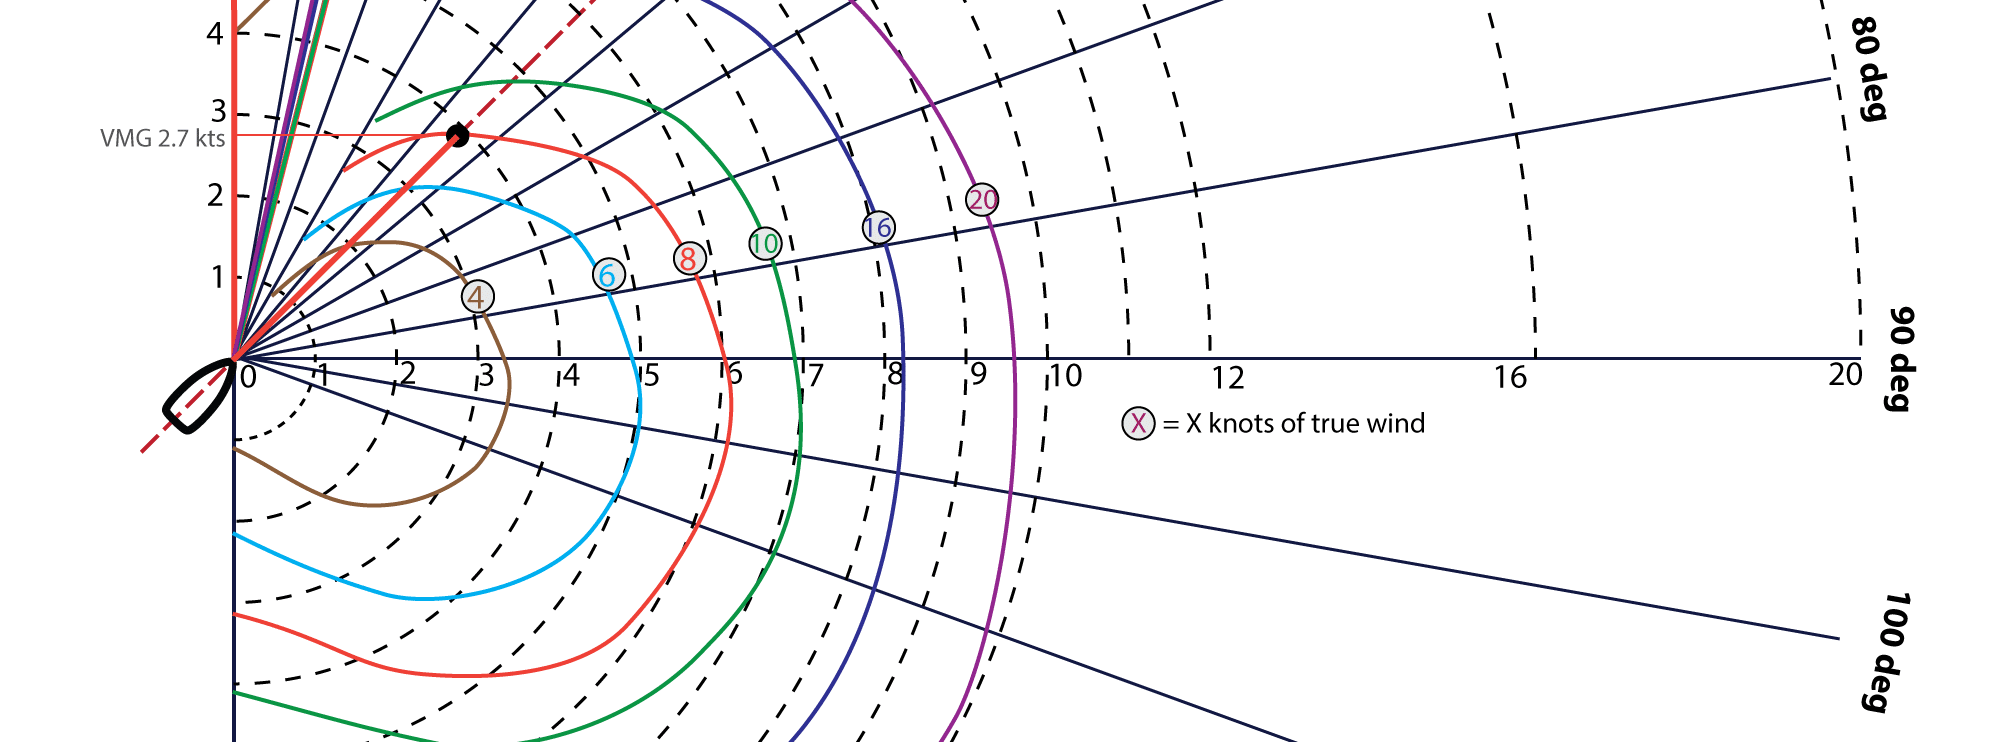
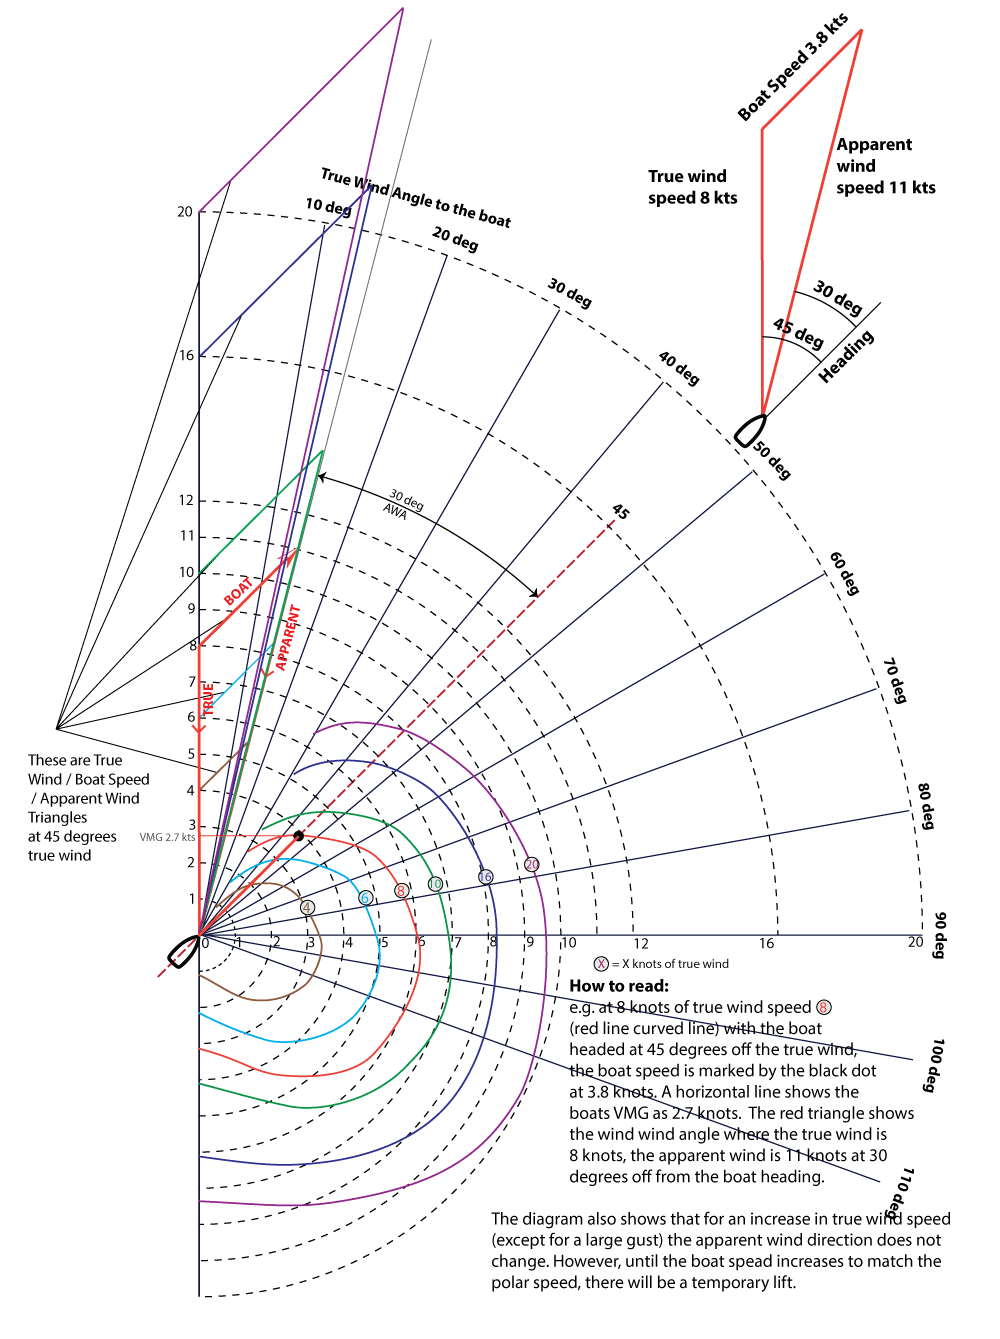
The following is a typical polar plot diagram of a typical monohull sailboat. The colored circular lines represent the boat’s speed at any given constant wind speed. The curves can be followed to see how fast the boat is going at any angle to the wind.
To test the hypothesis that the apparent wind angle stays the same when a true wind speed changes, what needed to be drawn was the True wind / Boat Speed / Apparent wind triangles at each true wind speed curve.
First, from the polar plot, at a specific true wind speed, you can determine the boat speed. You can then use this boat speed and true wind speed to create the wind triangle to find the apparent wind speed and the apparent wind angle.
What we found with this set of polar plots was that the apparent wind angle does not change for wind speeds of 4 through 10 knots. And even when the wind speed of 20 knots was applied only a few degrees of apparent wind angle was observed.
Thus, my friend Jamie is right. Jamie also goes on to say that a pure increase of decrease in true wind speed will happen exactly the same no matter what tack you were on – thus also proving that the change is neither a permanent lift or knock.
However, do note that this is for steady-state conditions. This means that after a wind change and the boat attains its appropriate polar plot speed, then the apparent wind angle will be as before. BUT, until the boat reaches its polar speed, immediately after a wind speed change, you WILL experience a temporary lift if the true wind speed increases or a temporary knock if the true wind speed decreases.
For example, if the wind speed increases, the apparent wind angle will move from a direction more in line with the true wind angle, thus you can turn the boat upwind a little to maintain an efficient apparent wind angle – this is the temporary lift. Once your boat speeds up to act according to the polar plot then you will have to turn back down wind a little.
The opposite is also true – if you experience a drop in true wind, your boat is then going faster than the polar plot and thus you will experience the apparent wind moving forward which appears as a knock. As the boat slows the apparent wind will move aft and back to its previous angle. In theory, you may or may not decide to bare away a little to keep the sails powered, or you may decide to hold your direction and allow the boat to slow with the decrease in wind – and thus hold higher than any other boats in the race who took it as a knock. But it is also impossible to tell if this was a constant direction decrease in true wind speed or a directional change as well. Thus, it is probably best to take it as a knock and watch the telltales diligently ready for a coming lift as the boat gets back on polar and thus keeping the sails powered.
Summary of the above? Sail the telltales! Oh and Jamie was right (in steady state)!
See also this article which uses an animation to show the boat traveling on a polar plot curve: How to read a Polar Plot for Sailboats
This is the polar plot diagram we used which uses a totally fictitious boat but is typical. Click the image to download a printable PDF.
LEARN SAIL TRIM
Learn more about sail trim with either NauticEd’s FREE Basic Sail Trim Course for any aspiring sailor, or learn more comprehensive techniques with the Advanced Sail Trim online course.


